Optimising commute time
I have recently moved to Zürich and now am facing a dilemma: where should I live? Having a short commute and opportunity to cycle are particularly important to me. Here, I solve this problem by analysing commute data and thus finding optimal locations to live.
Method
I gather data from Google Maps since it has public transport schedules. The idea is to measure the commute time from every street in Zurich to my work. We could gather this data manually by using maps.google.com, but Google conveniently offers computerised access to this data via API (for free!):
# python3
import googlemaps
gmaps = googlemaps.Client(key="private_API_key_that_you_get_from_Google_cloud")

# (...helper code...)

job_loc = parse_coordinates( gmaps.geocode(
    "Google Building 110, Brandschenkestrasse 110, 8002 Zürich") )

print("Job location:", job_loc)
# => Job location: (47.3653139, 8.524474699999999)
These are the coordinates for my new job at Google. Now, I want to estimate commute times to these coordinates from different places in the city. Function distance_matrix allows getting the time for a specific mode of transport. We query this function for many points on a rectangular grid,
# (...helper code...)

res = [] # store results

for dx in np.arange(-40, 41)*dLon*500: # grid in Longitude
    for dy in np.arange(-40, 41)*dLat*500: # grid in Latitude
        x, y = job_loc[1] + dx, job_loc[0] + dy # from coordinates
        distance = gmaps.distance_matrix(
             origins = (y,x),
             destinations = job_loc,
             mode = "transit",  # or "bicycling"
             units = "metric",
             arrival_time =
               parser.parse("2018-12-20T09:00:00+01"), # date must be in the future
         )
         res.append(_parse_distance_matrix(distance))
Of course, we could do this manually, but it would take us a long time since there are over 6000 points on this grid. Let the computer do the work 🤖
Commute times
Figure 1 shows the commute times using public transport. Green color indicates shorter commute times, while red indicates longer commute times. The contour lines indicate zones where the commute is within 20 minutes, 30 minutes, and 40 minutes.
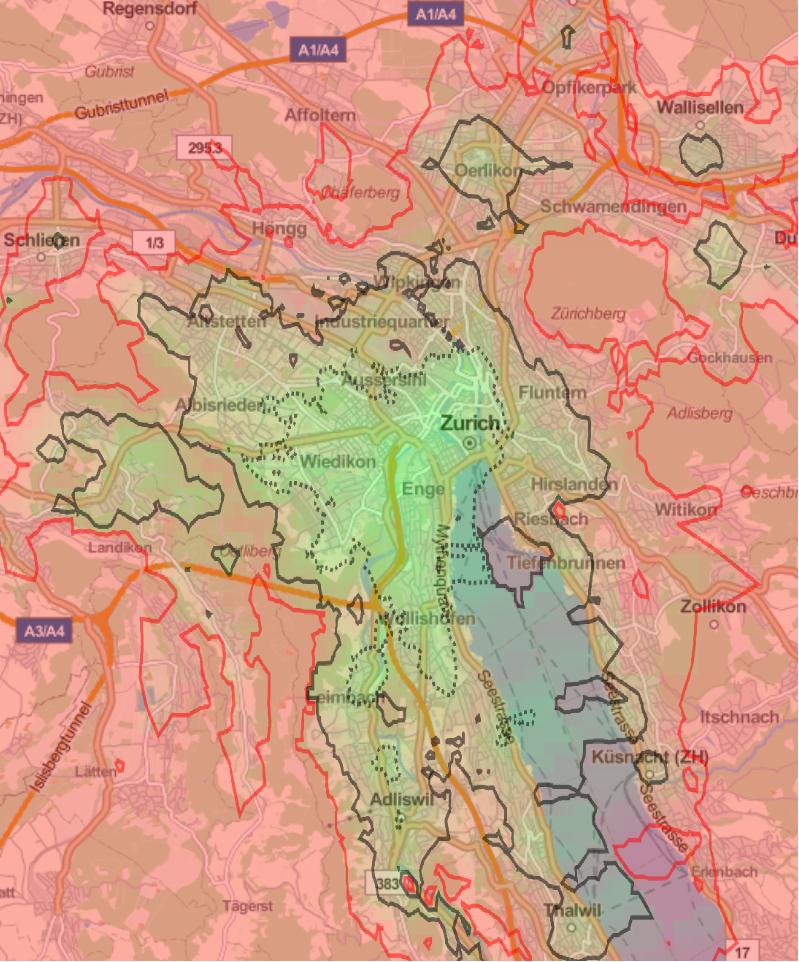
Figure 1. Public transport commute. Dashed line shows 20min commute zone; solid line is 30min zone; and solid red line is 40min zone.
The data clearly suggest that living closer to work reduces the commute time; no surprise here. However, the commute times are not uniformly distributed around the office, with 20 minute zone extending a lot further south than in any other direction. This is because there are faster train lines going south that allow shorter commute times. This was not obvious to me before starting the analysis and it helps to find the ideal location.
A small technical note on transport in water. Google Maps just teleport you to the closest shore and estimates the commute time from there. Thus, the commute times in water do not reflect of owing a house-boat but are just an artefact of getting data off Google Maps API.
Next, I would like to cycle to work if the weather permits. Using the same method, I get commute times shown in Figure 2.
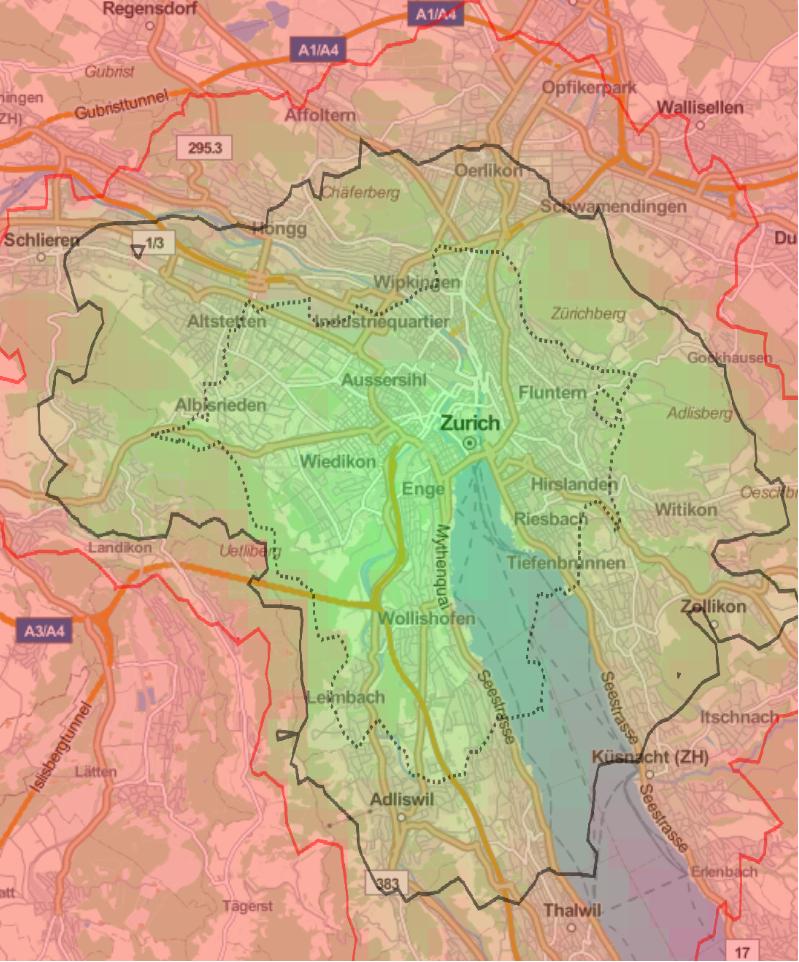
Figure 2. Cycling commute. Dashed line shows 20min commute zone; solid line is with 30min; and solid red line is within 40min commute.
Clearly, the short commute zones are more symmetrically distributed around my office location. The 20 minute zone is also larger than for the public transport, presumably because There is no walking to and from bus or train stations.
Combining data from both figures, it seems the ideal locations include: old town, Wiedlikon, Aussersihl, Enge, Wollishofen, and even Leimbach.
Night transport
Occasionally I want to take the public transport in the late evening after seeing friends or some event. I will use the same method to estimate transport options from the old town of Zurich to different locations that I consider living in. This time I fix the leaving time to 15 minutes before midnight on Saturday. For me, these conditions reflect a common scenario where I still prefer using public transport.
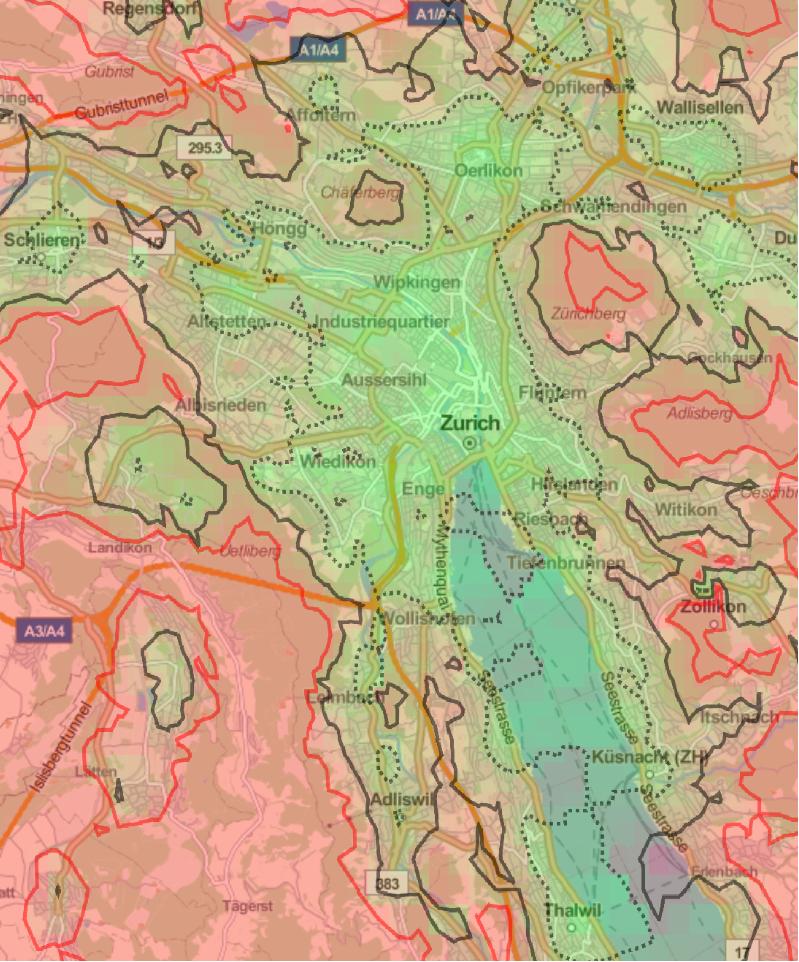
Figure 3. Public transport at night from the city centre. Dashed line shows 20min travel zone; solid line is 30min zone; and solid red line is 40min zone.
Figure 3 shows the time it takes to get home from the city centre around midnight. The 20 min travel zone is larger than in the commute estimate because here we are computing the distance from Zürich HB - the main train station. This data suggests that it is straightforward to get home from most places in the city.
Try it yourself
You will need:
- Google Maps API key. It is free for a small number of queries, but you will have to leave a credit/debit card with Google Could. You can deactivate the account after the analysis.
- Python3 (via anaconda). Also free.
- Wolfram Mathematica for visualisations. This tool is unfortunately not free, but you can try using it on Wolfram Cloud which is free for moderate usage. Also, similar visualisations can be made in python, but I have not done it.
The code is on GitHub. Hope it empowers your next relocation. Send me thanks if it makes a big difference.
This article and the opinions in it are my own and not an official statement from my employer.
on